Data imputation

Missing data (N = 1) were imputed by multiple imputation with chained equations (MICE; mice R package version 3.13.0) employing predictive mean matching (Morris et al., 2014; number of imputation sets m = 50). All primary and secondary endpoints as well as group, age, and sex were integrated as predictors in the imputation model.

# Load data
load.Rdata(filename = "./data/qn_data.Rdata", "qn_data")

# Load package
# https://www.r-bloggers.com/2015/10/imputing-missing-data-with-r-mice-package/
library(mice)

# Subset datase Primary/ secondary measures, group age, gender
qn_data_sub = subset(qn_data, select = c("ID", "group", "age", "sex", "GEM_Total_T1", 
    "GEM_Total_T2", "EMK_EM_P_T1", "EMK_EM_P_T2", "EMK_EM_CH_T1", "EMK_EM_CH_T2", 
    "EMK_ER_P_T1", "EMK_ER_P_T2", "EMK_ER_CH_T1", "EMK_ER_CH_T2", "EMK_PB_CH_T1", 
    "EMK_PB_CH_T2", "SDQ_PB_T1", "SDQ_PB_T2", "SDQ_Total_T1", "SDQ_Total_T2"))

# Do the imputing (pmm --> Predictive Mean Matching, m = 50)
tempData = mice(qn_data_sub, m = 50, maxit = 50, meth = "pmm", seed = 500)
qn_data_itt = complete(tempData, 1)

# Save in Rdata format
save(qn_data_itt, file = "./data/qn_data_itt.RData")

Visualization of effects

# For visualization purposes all behavioral measures were z-standardized
qn_data_itt$zd_GEM_Total = scale(qn_data_itt$d_GEM_Total, center = TRUE, scale = TRUE)
qn_data_itt$zd_EMK_EM_CH = scale(qn_data_itt$d_EMK_EM_CH, center = TRUE, scale = TRUE)
qn_data_itt$zd_EMK_EM_P = scale(qn_data_itt$d_EMK_EM_P, center = TRUE, scale = TRUE)
qn_data_itt$zd_EMK_ER_CH = scale(qn_data_itt$d_EMK_ER_CH, center = TRUE, scale = TRUE)
qn_data_itt$zd_EMK_ER_P = scale(qn_data_itt$d_EMK_ER_P, center = TRUE, scale = TRUE)
qn_data_itt$zd_EMK_PB_CH = scale(qn_data_itt$d_EMK_PB_CH, center = TRUE, scale = TRUE)
qn_data_itt$zd_SDQ_PB = scale(qn_data_itt$d_SDQ_PB, center = TRUE, scale = TRUE)
qn_data_itt$zd_SDQ_Total = scale(qn_data_itt$d_SDQ_Total, center = TRUE, scale = TRUE)

# Separate data for CG and TG
qn_data_d_scors = subset(qn_data_itt, select = c(group, zd_GEM_Total, zd_EMK_EM_CH, 
    zd_EMK_EM_P, zd_EMK_ER_CH, zd_EMK_ER_P, zd_EMK_PB_CH, zd_SDQ_PB, zd_SDQ_Total))
qn_data_d_scors_TG = subset(qn_data_d_scors, group == "TG")
qn_data_d_scors_TG = gather(qn_data_d_scors_TG, measure, TG, zd_GEM_Total:zd_SDQ_Total, 
    factor_key = TRUE)


qn_data_d_scors_CG = subset(qn_data_d_scors, group == "CG")
qn_data_d_scors_CG = gather(qn_data_d_scors_CG, measure, CG, zd_GEM_Total:zd_SDQ_Total, 
    factor_key = TRUE)
names(qn_data_d_scors_CG)[3] = "TG"

qn_data_d_scors = rbind(qn_data_d_scors_TG, qn_data_d_scors_CG)
names(qn_data_d_scors)[3] = "score"

# Visualize separate training outcomes
sep_scores_box = ggplot(qn_data_d_scors, aes(x = measure, y = score, fill = group)) + 
    # add shaded areas
annotate("rect", xmin = 2.6, xmax = 3.4, ymin = -2, ymax = 2.8, alpha = 0.2) + annotate("rect", 
    xmin = 3.6, xmax = 4.4, ymin = -2, ymax = 2.8, alpha = 0.2) + # annotate('rect', xmin = 4.6, xmax = 5.4, ymin = -2, ymax = 2.8, alpha = .2)+
annotate("rect", xmin = 6.6, xmax = 7.4, ymin = -2, ymax = 2.8, alpha = 0.2) + annotate("rect", 
    xmin = 7.6, xmax = 8.4, ymin = -2, ymax = 2.8, alpha = 0.2) + stat_boxplot(geom = "errorbar", 
    width = 0.5, size = 0.7, coef = 1, position = position_dodge(0.65)) + geom_boxplot(coef = 1, 
    outlier.shape = NA, width = 0.7, lwd = 1, alpha = 1, position = position_dodge(0.65)) + 
    labs(x = "", y = "d [z-standardized]") + scale_x_discrete(labels = c(expression(GEM[P]), 
    expression(EMK:EM[CH]), expression(EMK:EM[P]), expression(EMK:ER[CH]), expression(EMK:ER[P]), 
    expression(EMK:PB[CH]), expression(SDQ:PB[P]), expression(SDQ:BP[P]))) + scale_fill_manual(labels = c("Controls", 
    "Zirkus Empathico"), values = ZE_col) + theme_bw() + theme_SN + theme(axis.text.x = element_text(size = 10), 
    legend.position = "top", legend.title = element_blank(), axis.title.y = element_text(size = 10, 
        margin = margin(t = 0, r = 5, b = 0, l = 0)), axis.ticks.x = element_blank(), 
    axis.text.y = element_text(size = 10)) + coord_cartesian(ylim = c(-2.2, 2.8), 
    expand = FALSE, clip = "off") + # add asteriks
annotate("text", x = c(3, 4, 7, 8), y = 2.4, label = "\"*\"", fontface = "bold", 
    size = 9, parse = TRUE) + # add shaded x-axis extension
annotate("text", x = 2, y = -2.8, label = "Empathy", size = 4) + annotate("text", 
    x = 4.5, y = -2.8, label = "Emotion recognition", size = 4) + annotate("text", 
    x = 7, y = -2.8, label = "Prosocial behavior", size = 4) + annotate("segment", 
    x = 3.5, xend = 3.5, y = -2.2, yend = -2.7, colour = "gray31") + annotate("segment", 
    x = 5.5, xend = 5.5, y = -2.2, yend = -2.7, colour = "gray31")

# Show plot
sep_scores_box

ggsave(sep_scores_box, file = "zerp_sec_measures.png", dpi = 300)

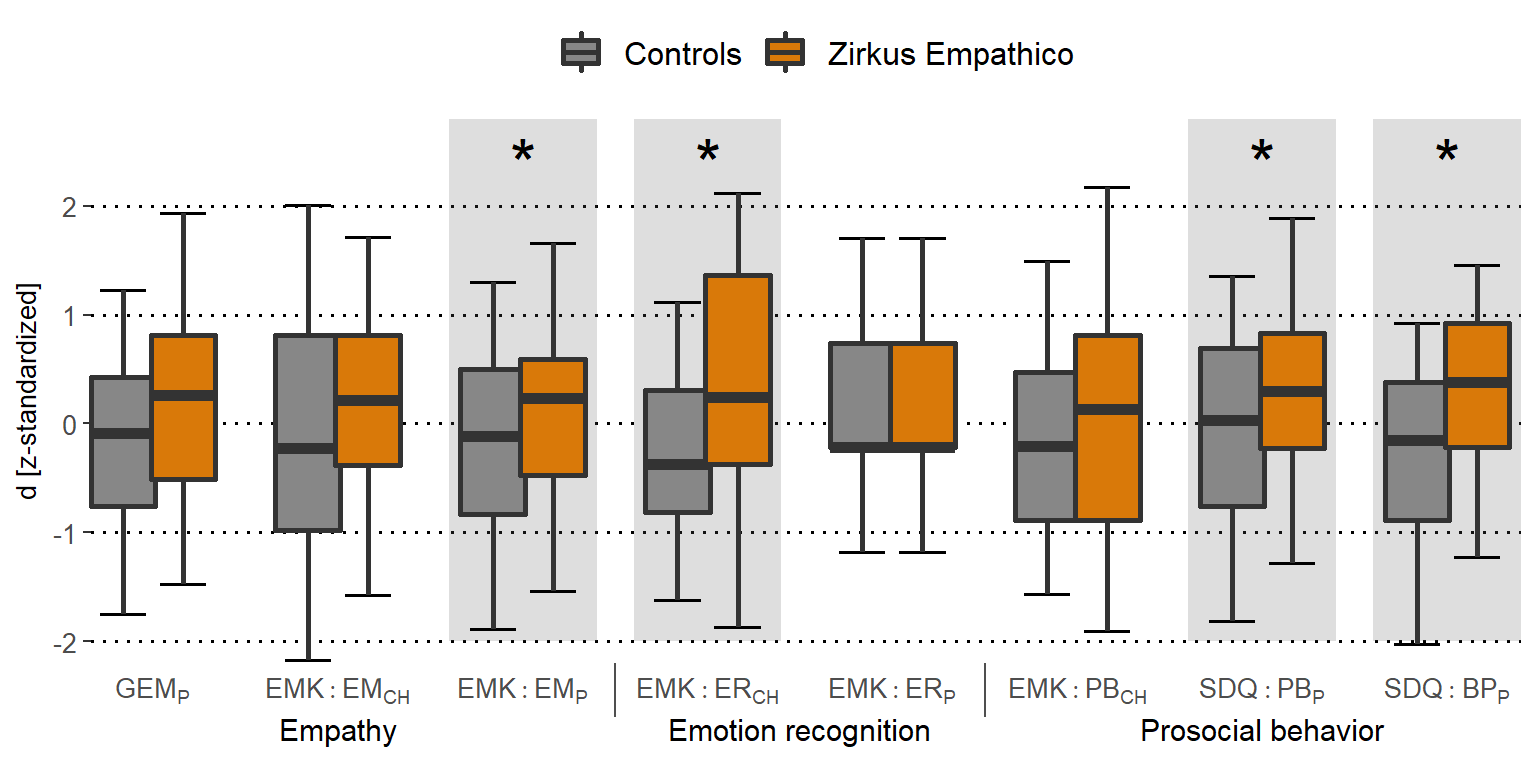
Parent and child ratings of socio-emotional competence (SEC) reports. Orange: Zirkus Empathico group. Grey: Control training. Error bars indicate standard errors (SE); d z-standardized represents the standardized change scores (difference between post- and pre-training values). Note: Standardization was achieved by subtracting each value from the variables mean and dividing them by the variable’s standard deviation (x – x̄) /SD). Standardization was only carried out for visualization purposes; statistical analyses were carried out with the raw d values. GEM = Griffith Empathy Measure; EMK = Inventory to survey of emotional competences for three- to six-year-olds; EM = Empathy; ER = Emotion recognition; SDQ = Strength and Difficulties Questionnaire; PB = Prosocial behavior; BP = Behavioral problems. P = parent rating; CH = child assessment.

Primary outcome: Empathy

GEM

ITT


Without training time

gem_total_an = aov_ez("ID", "d_GEM_Total", qn_data_itt, between = c("group"), covariate = c("GEM_Total_T1"), 
    observed = c("GEM_Total_T1"), factorize = FALSE, anova_table = list(correction = "none", 
        es = "pes"))


pander(gem_total_an$anova_table)
Anova Table (Type 3 tests)
  num Df den Df MSE F pes Pr(>F)
group 1 71 184.2 0.9933 0.0138 0.3223
GEM_Total_T1 1 71 184.2 6.774 0.0871 0.01125
# https://thenewstatistics.com/itns/2020/07/04/3-easy-ways-to-obtain-cohens-d-and-its-ci/

# Calculate mean and SD (and square them) for T2-T1 difference per group (ZE and
# CG)
mean_rel_CG = mean(qn_data_itt[qn_data_itt$group == "CG", ]$d_GEM_Total)
mean_rel_TG = mean(qn_data_itt[qn_data_itt$group == "TG", ]$d_GEM_Total)

sd_rel_CG = sd(qn_data_itt[qn_data_itt$group == "CG", ]$d_GEM_Total)
sd_rel_TG = sd(qn_data_itt[qn_data_itt$group == "TG", ]$d_GEM_Total)

# Calculate difference between TG and CG
diff_mean_TG_CG = mean_rel_TG - mean_rel_CG

# Get number of participants per group
pnum = table(qn_data_itt["group"])
pnum_CG = pnum[1]
pnum_TG = pnum[2]

# Get Cohen's and confidence intervals
estimate = estimateStandardizedMeanDifference(mean_rel_TG, mean_rel_CG, sd_rel_TG, 
    sd_rel_CG, pnum_TG, pnum_CG, conf.level = 0.95)

# Retrieve them from list
GEM_Total_d_itt = estimate$cohend
GEM_Total_low_d_itt = estimate$cohend.low
GEM_Total_high_d_itt = estimate$cohend.high


With training time

gem_total_an = aov_ez("ID", "d_GEM_Total", qn_data_itt, between = c("group"), covariate = c("GEM_Total_T1", 
    "train_time"), observed = c("GEM_Total_T1", "train_time"), factorize = FALSE, 
    anova_table = list(correction = "none", es = "pes"))


pander(gem_total_an$anova_table)
Anova Table (Type 3 tests)
  num Df den Df MSE F pes Pr(>F)
group 1 67 183.9 0.3401 0.00505 0.5617
GEM_Total_T1 1 67 183.9 4.909 0.06826 0.03012
train_time 1 67 183.9 2.111 0.03055 0.1509

PP

Without training time

gem_total_an = aov_ez("ID", "d_GEM_Total", qn_data_pp, between = c("group"), covariate = c("GEM_Total_T1"), 
    observed = c("GEM_Total_T1"), factorize = FALSE, anova_table = list(correction = "none", 
        es = "pes"))

pander(gem_total_an$anova_table)
Anova Table (Type 3 tests)
  num Df den Df MSE F pes Pr(>F)
group 1 69 182.7 0.8724 0.01249 0.3535
GEM_Total_T1 1 69 182.7 5.191 0.06997 0.0258
# https://thenewstatistics.com/itns/2020/07/04/3-easy-ways-to-obtain-cohens-d-and-its-ci/

# Calculate mean and SD (and square them) for T2-T1 difference per group (ZE and
# CG)
mean_rel_CG = mean(qn_data_pp[qn_data_pp$group == "CG", ]$d_GEM_Total)
mean_rel_TG = mean(qn_data_pp[qn_data_pp$group == "TG", ]$d_GEM_Total)

sd_rel_CG = sd(qn_data_pp[qn_data_pp$group == "CG", ]$d_GEM_Total)
sd_rel_TG = sd(qn_data_pp[qn_data_pp$group == "TG", ]$d_GEM_Total)

# Calculate difference between TG and CG
diff_mean_TG_CG = mean_rel_TG - mean_rel_CG

# Get number of participants per group
pnum = table(qn_data_pp["group"])
pnum_CG = pnum[1]
pnum_TG = pnum[2]

# Get Cohen's and confidence intervals
estimate = estimateStandardizedMeanDifference(mean_rel_TG, mean_rel_CG, sd_rel_TG, 
    sd_rel_CG, pnum_TG, pnum_CG, conf.level = 0.95)

# Retrieve them from list
GEM_Total_d_pp = estimate$cohend
GEM_Total_low_d_pp = estimate$cohend.low
GEM_Total_high_d_pp = estimate$cohend.high


With training time

gem_total_an = aov_ez("ID", "d_GEM_Total", qn_data_pp, between = c("group"), covariate = c("GEM_Total_T1", 
    "train_time"), observed = c("GEM_Total_T1", "train_time"), factorize = FALSE, 
    anova_table = list(correction = "none", es = "pes"))


pander(gem_total_an$anova_table)
Anova Table (Type 3 tests)
  num Df den Df MSE F pes Pr(>F)
group 1 66 184.6 0.4706 0.00708 0.4951
GEM_Total_T1 1 66 184.6 5.123 0.07203 0.02691
train_time 1 66 184.6 2.125 0.03119 0.1497

EMK 3-6 EM CH

ITT


Without training time

# ANCOVA EMK_EM_CH

EMK_EM_CH_an = aov_ez("ID", "d_EMK_EM_CH", qn_data_itt, between = c("group"), covariate = c("EMK_EM_CH_T1"), 
    observed = c("EMK_EM_CH_T1"), factorize = FALSE, anova_table = list(correction = "none", 
        es = "pes"))

pander(EMK_EM_CH_an$anova_table)
Anova Table (Type 3 tests)
  num Df den Df MSE F pes Pr(>F)
group 1 71 9.256 3.498 0.04695 0.06558
EMK_EM_CH_T1 1 71 9.256 15.49 0.1791 0.0001916
# https://thenewstatistics.com/itns/2020/07/04/3-easy-ways-to-obtain-cohens-d-and-its-ci/

# Calculate mean and SD (and square them) for T2-T1 difference per group (ZE and
# CG)
mean_rel_CG = mean(qn_data_itt[qn_data_itt$group == "CG", ]$d_EMK_EM_CH)
mean_rel_TG = mean(qn_data_itt[qn_data_itt$group == "TG", ]$d_EMK_EM_CH)

sd_rel_CG = sd(qn_data_itt[qn_data_itt$group == "CG", ]$d_EMK_EM_CH)
sd_rel_TG = sd(qn_data_itt[qn_data_itt$group == "TG", ]$d_EMK_EM_CH)

# Calculate difference between TG and CG
diff_mean_TG_CG = mean_rel_TG - mean_rel_CG

# Get number of participants per group
pnum = table(qn_data_itt["group"])
pnum_CG = pnum[1]
pnum_TG = pnum[2]

# Get Cohen's and confidence intervals
estimate = estimateStandardizedMeanDifference(mean_rel_TG, mean_rel_CG, sd_rel_TG, 
    sd_rel_CG, pnum_TG, pnum_CG, conf.level = 0.95)

# Retrieve them from list
EMK_EM_CH_d_itt = estimate$cohend
EMK_EM_CH_low_d_itt = estimate$cohend.low
EMK_EM_CH_high_d_itt = estimate$cohend.high

With training time

# ANCOVA EMK_EM_CH

EMK_EM_CH_an = aov_ez("ID", "d_EMK_EM_CH", qn_data_itt, between = c("group"), covariate = c("EMK_EM_CH_T1", 
    "train_time"), observed = c("EMK_EM_CH_T1", "train_time"), factorize = FALSE, 
    anova_table = list(correction = "none", es = "pes"))

pander(EMK_EM_CH_an$anova_table)
Anova Table (Type 3 tests)
  num Df den Df MSE F pes Pr(>F)
group 1 67 9.185 3.161 0.04506 0.07993
EMK_EM_CH_T1 1 67 9.185 16.67 0.1993 0.0001207
train_time 1 67 9.185 0.6096 0.009016 0.4377

PP

Without training time

# ANCOVA EMK_EM_CH

EMK_EM_CH_an = aov_ez("ID", "d_EMK_EM_CH", qn_data_pp, between = c("group"), covariate = c("EMK_EM_CH_T1"), 
    observed = c("EMK_EM_CH_T1"), factorize = FALSE, anova_table = list(correction = "none", 
        es = "pes"))

pander(EMK_EM_CH_an$anova_table)
Anova Table (Type 3 tests)
  num Df den Df MSE F pes Pr(>F)
group 1 69 9.306 2.917 0.04057 0.09213
EMK_EM_CH_T1 1 69 9.306 16.42 0.1922 0.0001313
# https://thenewstatistics.com/itns/2020/07/04/3-easy-ways-to-obtain-cohens-d-and-its-ci/

# Calculate mean and SD (and square them) for T2-T1 difference per group (ZE and
# CG)
mean_rel_CG = mean(qn_data_pp[qn_data_pp$group == "CG", ]$d_EMK_EM_CH)
mean_rel_TG = mean(qn_data_pp[qn_data_pp$group == "TG", ]$d_EMK_EM_CH)

sd_rel_CG = sd(qn_data_pp[qn_data_pp$group == "CG", ]$d_EMK_EM_CH)
sd_rel_TG = sd(qn_data_pp[qn_data_pp$group == "TG", ]$d_EMK_EM_CH)

# Calculate difference between TG and CG
diff_mean_TG_CG = mean_rel_TG - mean_rel_CG

# Get number of participants per group
pnum = table(qn_data_pp["group"])
pnum_CG = pnum[1]
pnum_TG = pnum[2]

# Get Cohen's and confidence intervals
estimate = estimateStandardizedMeanDifference(mean_rel_TG, mean_rel_CG, sd_rel_TG, 
    sd_rel_CG, pnum_TG, pnum_CG, conf.level = 0.95)

# Retrieve them from list
EMK_EM_CH_d_pp = estimate$cohend
EMK_EM_CH_low_d_pp = estimate$cohend.low
EMK_EM_CH_high_d_pp = estimate$cohend.high


With training time

# ANCOVA EMK_EM_CH

EMK_EM_CH_an = aov_ez("ID", "d_EMK_EM_CH", qn_data_pp, between = c("group"), covariate = c("EMK_EM_CH_T1", 
    "train_time"), observed = c("EMK_EM_CH_T1", "train_time"), factorize = FALSE, 
    anova_table = list(correction = "none", es = "pes"))

pander(EMK_EM_CH_an$anova_table)
Anova Table (Type 3 tests)
  num Df den Df MSE F pes Pr(>F)
group 1 66 9.324 3.07 0.04445 0.08439
EMK_EM_CH_T1 1 66 9.324 16.35 0.1986 0.00014
train_time 1 66 9.324 0.6005 0.009016 0.4412

EMK 3-6 EM P

ITT


Without training time

EMK_EM_P_an = aov_ez("ID", "d_EMK_EM_P", qn_data_itt, between = c("group"), covariate = c("EMK_EM_P_T1"), 
    observed = c("EMK_EM_P_T1"), factorize = FALSE, anova_table = list(correction = "none", 
        es = "pes"))

pander(EMK_EM_P_an$anova_table)
Anova Table (Type 3 tests)
  num Df den Df MSE F pes Pr(>F)
group 1 71 6.603 4.136 0.05505 0.04571
EMK_EM_P_T1 1 71 6.603 15.11 0.1755 0.0002253
# https://thenewstatistics.com/itns/2020/07/04/3-easy-ways-to-obtain-cohens-d-and-its-ci/

# Calculate mean and SD (and square them) for T2-T1 difference per group (ZE and
# CG)
mean_rel_CG = mean(qn_data_itt[qn_data_itt$group == "CG", ]$d_EMK_EM_P)
mean_rel_TG = mean(qn_data_itt[qn_data_itt$group == "TG", ]$d_EMK_EM_P)

sd_rel_CG = sd(qn_data_itt[qn_data_itt$group == "CG", ]$d_EMK_EM_P)
sd_rel_TG = sd(qn_data_itt[qn_data_itt$group == "TG", ]$d_EMK_EM_P)

# Calculate difference between TG and CG
diff_mean_TG_CG = mean_rel_TG - mean_rel_CG

# Get number of participants per group
pnum = table(qn_data_itt["group"])
pnum_CG = pnum[1]
pnum_TG = pnum[2]

# Get Cohen's and confidence intervals
estimate = estimateStandardizedMeanDifference(mean_rel_TG, mean_rel_CG, sd_rel_TG, 
    sd_rel_CG, pnum_TG, pnum_CG, conf.level = 0.95)

# Retrieve them from list
EMK_EM_P_d_itt = estimate$cohend
EMK_EM_P_low_d_itt = estimate$cohend.low
EMK_EM_P_high_d_itt = estimate$cohend.high


With training time

EMK_EM_P_an = aov_ez("ID", "d_EMK_EM_P", qn_data_itt, between = c("group"), covariate = c("EMK_EM_P_T1", 
    "train_time"), observed = c("EMK_EM_P_T1", "train_time"), factorize = FALSE, 
    anova_table = list(correction = "none", es = "pes"))

pander(EMK_EM_P_an$anova_table)
Anova Table (Type 3 tests)
  num Df den Df MSE F pes Pr(>F)
group 1 67 6.472 5.601 0.07714 0.02085
EMK_EM_P_T1 1 67 6.472 16.64 0.199 0.0001224
train_time 1 67 6.472 0.07457 0.001112 0.7856

PP

Without training time

EMK_EM_P_an = aov_ez("ID", "d_EMK_EM_P", qn_data_pp, between = c("group"), covariate = c("EMK_EM_P_T1"), 
    observed = c("EMK_EM_P_T1"), factorize = FALSE, anova_table = list(correction = "none", 
        es = "pes"))

pander(EMK_EM_P_an$anova_table)
Anova Table (Type 3 tests)
  num Df den Df MSE F pes Pr(>F)
group 1 69 6.377 6.004 0.08005 0.01681
EMK_EM_P_T1 1 69 6.377 19.15 0.2172 0.00004194
# https://thenewstatistics.com/itns/2020/07/04/3-easy-ways-to-obtain-cohens-d-and-its-ci/

# Calculate mean and SD (and square them) for T2-T1 difference per group (ZE and
# CG)
mean_rel_CG = mean(qn_data_pp[qn_data_pp$group == "CG", ]$d_EMK_EM_P)
mean_rel_TG = mean(qn_data_pp[qn_data_pp$group == "TG", ]$d_EMK_EM_P)

sd_rel_CG = sd(qn_data_pp[qn_data_pp$group == "CG", ]$d_EMK_EM_P)
sd_rel_TG = sd(qn_data_pp[qn_data_pp$group == "TG", ]$d_EMK_EM_P)

# Calculate difference between TG and CG
diff_mean_TG_CG = mean_rel_TG - mean_rel_CG

# Get number of participants per group
pnum = table(qn_data_pp["group"])
pnum_CG = pnum[1]
pnum_TG = pnum[2]

# Get Cohen's and confidence intervals
estimate = estimateStandardizedMeanDifference(mean_rel_TG, mean_rel_CG, sd_rel_TG, 
    sd_rel_CG, pnum_TG, pnum_CG, conf.level = 0.95)

# Retrieve them from list
EMK_EM_P_d_pp = estimate$cohend
EMK_EM_P_low_d_pp = estimate$cohend.low
EMK_EM_P_high_d_pp = estimate$cohend.high


With training time

EMK_EM_P_an = aov_ez("ID", "d_EMK_EM_P", qn_data_pp, between = c("group"), covariate = c("EMK_EM_P_T1", 
    "train_time"), observed = c("EMK_EM_P_T1", "train_time"), factorize = FALSE, 
    anova_table = list(correction = "none", es = "pes"))

pander(EMK_EM_P_an$anova_table)
Anova Table (Type 3 tests)
  num Df den Df MSE F pes Pr(>F)
group 1 66 6.55 5.694 0.07942 0.0199
EMK_EM_P_T1 1 66 6.55 16.06 0.1957 0.0001584
train_time 1 66 6.55 0.06639 0.001005 0.7975

Secondary outcome: Emotion recognition

EMK 3-6 ER CH

ITT


Without training time

EMK_ER_CH_an = aov_ez("ID", "d_EMK_ER_CH", qn_data_itt, between = c("group"), covariate = c("EMK_ER_CH_T1"), 
    observed = c("EMK_ER_CH_T1"), factorize = FALSE, anova_table = list(correction = "none", 
        es = "pes"))

pander(EMK_ER_CH_an$anova_table)
Anova Table (Type 3 tests)
  num Df den Df MSE F pes Pr(>F)
group 1 71 12.42 7.979 0.101 0.006138
EMK_ER_CH_T1 1 71 12.42 16.24 0.1861 0.0001387
# https://thenewstatistics.com/itns/2020/07/04/3-easy-ways-to-obtain-cohens-d-and-its-ci/

# Calculate mean and SD (and square them) for T2-T1 difference per group (ZE and
# CG)
mean_rel_CG = mean(qn_data_itt[qn_data_itt$group == "CG", ]$d_EMK_ER_CH)
mean_rel_TG = mean(qn_data_itt[qn_data_itt$group == "TG", ]$d_EMK_ER_CH)

sd_rel_CG = sd(qn_data_itt[qn_data_itt$group == "CG", ]$d_EMK_ER_CH)
sd_rel_TG = sd(qn_data_itt[qn_data_itt$group == "TG", ]$d_EMK_ER_CH)

# Calculate difference between TG and CG
diff_mean_TG_CG = mean_rel_TG - mean_rel_CG

# Get number of participants per group
pnum = table(qn_data_itt["group"])
pnum_CG = pnum[1]
pnum_TG = pnum[2]

# Get Cohen's and confidence intervals
estimate = estimateStandardizedMeanDifference(mean_rel_TG, mean_rel_CG, sd_rel_TG, 
    sd_rel_CG, pnum_TG, pnum_CG, conf.level = 0.95)

# Retrieve them from list
EMK_ER_CH_d_itt = estimate$cohend
EMK_ER_CH_low_d_itt = estimate$cohend.low
EMK_ER_CH_high_d_itt = estimate$cohend.high


With training time

EMK_ER_CH_an = aov_ez("ID", "d_EMK_ER_CH", qn_data_itt, between = c("group"), covariate = c("EMK_ER_CH_T1", 
    "train_time"), observed = c("EMK_ER_CH_T1", "train_time"), factorize = FALSE, 
    anova_table = list(correction = "none", es = "pes"))

pander(EMK_ER_CH_an$anova_table)
Anova Table (Type 3 tests)
  num Df den Df MSE F pes Pr(>F)
group 1 67 10.93 10.81 0.1389 0.001611
EMK_ER_CH_T1 1 67 10.93 21.66 0.2443 0.00001584
train_time 1 67 10.93 0.02716 0.0004052 0.8696

PP

Without training time

EMK_ER_CH_an = aov_ez("ID", "d_EMK_ER_CH", qn_data_pp, between = c("group"), covariate = c("EMK_ER_CH_T1"), 
    observed = c("EMK_ER_CH_T1"), factorize = FALSE, anova_table = list(correction = "none", 
        es = "pes"))

pander(EMK_ER_CH_an$anova_table)
Anova Table (Type 3 tests)
  num Df den Df MSE F pes Pr(>F)
group 1 69 12.41 6.811 0.08984 0.0111
EMK_ER_CH_T1 1 69 12.41 16.73 0.1952 0.0001147
# https://thenewstatistics.com/itns/2020/07/04/3-easy-ways-to-obtain-cohens-d-and-its-ci/

# Calculate mean and SD (and square them) for T2-T1 difference per group (ZE and
# CG)
mean_rel_CG = mean(qn_data_pp[qn_data_pp$group == "CG", ]$d_EMK_ER_CH)
mean_rel_TG = mean(qn_data_pp[qn_data_pp$group == "TG", ]$d_EMK_ER_CH)

sd_rel_CG = sd(qn_data_pp[qn_data_pp$group == "CG", ]$d_EMK_ER_CH)
sd_rel_TG = sd(qn_data_pp[qn_data_pp$group == "TG", ]$d_EMK_ER_CH)

# Calculate difference between TG and CG
diff_mean_TG_CG = mean_rel_TG - mean_rel_CG

# Get number of participants per group
pnum = table(qn_data_pp["group"])
pnum_CG = pnum[1]
pnum_TG = pnum[2]

# Get Cohen's and confidence intervals
estimate = estimateStandardizedMeanDifference(mean_rel_TG, mean_rel_CG, sd_rel_TG, 
    sd_rel_CG, pnum_TG, pnum_CG, conf.level = 0.95)

# Retrieve them from list
EMK_ER_CH_d_pp = estimate$cohend
EMK_ER_CH_low_d_pp = estimate$cohend.low
EMK_ER_CH_high_d_pp = estimate$cohend.high


With training time

EMK_ER_CH_an = aov_ez("ID", "d_EMK_ER_CH", qn_data_pp, between = c("group"), covariate = c("EMK_ER_CH_T1", 
    "train_time"), observed = c("EMK_ER_CH_T1", "train_time"), factorize = FALSE, 
    anova_table = list(correction = "none", es = "pes"))

pander(EMK_ER_CH_an$anova_table)
Anova Table (Type 3 tests)
  num Df den Df MSE F pes Pr(>F)
group 1 66 11.1 10.51 0.1374 0.001864
EMK_ER_CH_T1 1 66 11.1 21.28 0.2438 0.0000188
train_time 1 66 11.1 0.02685 0.0004066 0.8703

EMK 3-6 ER P

ITT


Without training time

EMK_ER_P_an = aov_ez("ID", "d_EMK_ER_P", qn_data_itt, between = c("group"), covariate = c("EMK_ER_P_T1"), 
    observed = c("EMK_ER_P_T1"), factorize = FALSE, anova_table = list(correction = "none", 
        es = "pes"))

pander(EMK_ER_P_an$anova_table)
Anova Table (Type 3 tests)
  num Df den Df MSE F pes Pr(>F)
group 1 71 0.7044 2.132 0.02916 0.1486
EMK_ER_P_T1 1 71 0.7044 41.25 0.3675 0.00000001321
# https://thenewstatistics.com/itns/2020/07/04/3-easy-ways-to-obtain-cohens-d-and-its-ci/

# Calculate mean and SD (and square them) for T2-T1 difference per group (ZE and
# CG)
mean_rel_CG = mean(qn_data_itt[qn_data_itt$group == "CG", ]$d_EMK_ER_P)
mean_rel_TG = mean(qn_data_itt[qn_data_itt$group == "TG", ]$d_EMK_ER_P)

sd_rel_CG = sd(qn_data_itt[qn_data_itt$group == "CG", ]$d_EMK_ER_P)
sd_rel_TG = sd(qn_data_itt[qn_data_itt$group == "TG", ]$d_EMK_ER_P)

# Calculate difference between TG and CG
diff_mean_TG_CG = mean_rel_TG - mean_rel_CG

# Get number of participants per group
pnum = table(qn_data_itt["group"])
pnum_CG = pnum[1]
pnum_TG = pnum[2]

# Get Cohen's and confidence intervals
estimate = estimateStandardizedMeanDifference(mean_rel_TG, mean_rel_CG, sd_rel_TG, 
    sd_rel_CG, pnum_TG, pnum_CG, conf.level = 0.95)

# Retrieve them from list
EMK_ER_P_d_itt = estimate$cohend
EMK_ER_P_low_d_itt = estimate$cohend.low
EMK_ER_P_high_d_itt = estimate$cohend.high


With training time

EMK_ER_P_an = aov_ez("ID", "d_EMK_ER_P", qn_data_itt, between = c("group"), covariate = c("EMK_ER_P_T1", 
    "train_time"), observed = c("EMK_ER_P_T1", "train_time"), factorize = FALSE, 
    anova_table = list(correction = "none", es = "pes"))

pander(EMK_ER_P_an$anova_table)
Anova Table (Type 3 tests)
  num Df den Df MSE F pes Pr(>F)
group 1 67 0.7109 3.23 0.04599 0.0768
EMK_ER_P_T1 1 67 0.7109 41.46 0.3823 0.00000001508
train_time 1 67 0.7109 0.353 0.005241 0.5544

PP

Without training time

EMK_ER_P_an = aov_ez("ID", "d_EMK_ER_P", qn_data_pp, between = c("group"), covariate = c("EMK_ER_P_T1"), 
    observed = c("EMK_ER_P_T1"), factorize = FALSE, anova_table = list(correction = "none", 
        es = "pes"))

pander(EMK_ER_P_an$anova_table)
Anova Table (Type 3 tests)
  num Df den Df MSE F pes Pr(>F)
group 1 69 0.6722 3.969 0.0544 0.05029
EMK_ER_P_T1 1 69 0.6722 45.44 0.3971 0.000000003906
# https://thenewstatistics.com/itns/2020/07/04/3-easy-ways-to-obtain-cohens-d-and-its-ci/

# Calculate mean and SD (and square them) for T2-T1 difference per group (ZE and
# CG)
mean_rel_CG = mean(qn_data_pp[qn_data_pp$group == "CG", ]$d_EMK_ER_P)
mean_rel_TG = mean(qn_data_pp[qn_data_pp$group == "TG", ]$d_EMK_ER_P)

sd_rel_CG = sd(qn_data_pp[qn_data_pp$group == "CG", ]$d_EMK_ER_P)
sd_rel_TG = sd(qn_data_pp[qn_data_pp$group == "TG", ]$d_EMK_ER_P)

# Calculate difference between TG and CG
diff_mean_TG_CG = mean_rel_TG - mean_rel_CG

# Get number of participants per group
pnum = table(qn_data_pp["group"])
pnum_CG = pnum[1]
pnum_TG = pnum[2]

# Get Cohen's and confidence intervals
estimate = estimateStandardizedMeanDifference(mean_rel_TG, mean_rel_CG, sd_rel_TG, 
    sd_rel_CG, pnum_TG, pnum_CG, conf.level = 0.95)

# Retrieve them from list
EMK_ER_P_d_pp = estimate$cohend
EMK_ER_P_low_d_pp = estimate$cohend.low
EMK_ER_P_high_d_pp = estimate$cohend.high


With training time

EMK_ER_P_an = aov_ez("ID", "d_EMK_ER_P", qn_data_pp, between = c("group"), covariate = c("EMK_ER_P_T1", 
    "train_time"), observed = c("EMK_ER_P_T1", "train_time"), factorize = FALSE, 
    anova_table = list(correction = "none", es = "pes"))

pander(EMK_ER_P_an$anova_table)
Anova Table (Type 3 tests)
  num Df den Df MSE F pes Pr(>F)
group 1 66 0.6981 3.921 0.05607 0.05187
EMK_ER_P_T1 1 66 0.6981 42.24 0.3902 0.00000001247
train_time 1 66 0.6981 0.3442 0.005189 0.5594

Secondary outcome: Prosocial behavior

EMK 3-6 PB CH

ITT


Without training time

EMK_PB_CH_an = aov_ez("ID", "d_EMK_PB_CH", qn_data_itt, between = c("group"), covariate = c("EMK_PB_CH_T1"), 
    observed = c("EMK_PB_CH_T1"), factorize = FALSE, anova_table = list(correction = "none", 
        es = "pes"))

pander(EMK_PB_CH_an$anova_table)
Anova Table (Type 3 tests)
  num Df den Df MSE F pes Pr(>F)
group 1 71 6.007 0.3343 0.004687 0.565
EMK_PB_CH_T1 1 71 6.007 34.47 0.3268 0.0000001273
# https://thenewstatistics.com/itns/2020/07/04/3-easy-ways-to-obtain-cohens-d-and-its-ci/

# Calculate mean and SD (and square them) for T2-T1 difference per group (ZE and
# CG)
mean_rel_CG = mean(qn_data_itt[qn_data_itt$group == "CG", ]$d_EMK_PB_CH)
mean_rel_TG = mean(qn_data_itt[qn_data_itt$group == "TG", ]$d_EMK_PB_CH)

sd_rel_CG = sd(qn_data_itt[qn_data_itt$group == "CG", ]$d_EMK_PB_CH)
sd_rel_TG = sd(qn_data_itt[qn_data_itt$group == "TG", ]$d_EMK_PB_CH)

# Calculate difference between TG and CG
diff_mean_TG_CG = mean_rel_TG - mean_rel_CG

# Get number of participants per group
pnum = table(qn_data_itt["group"])
pnum_CG = pnum[1]
pnum_TG = pnum[2]

# Get Cohen's and confidence intervals
estimate = estimateStandardizedMeanDifference(mean_rel_TG, mean_rel_CG, sd_rel_TG, 
    sd_rel_CG, pnum_TG, pnum_CG, conf.level = 0.95)

# Retrieve them from list
EMK_PB_CH_d_itt = estimate$cohend
EMK_PB_CH_low_d_itt = estimate$cohend.low
EMK_PB_CH_high_d_itt = estimate$cohend.high


With training time

EMK_PB_CH_an = aov_ez("ID", "d_EMK_PB_CH", qn_data_itt, between = c("group"), covariate = c("EMK_PB_CH_T1", 
    "train_time"), observed = c("EMK_PB_CH_T1", "train_time"), factorize = FALSE, 
    anova_table = list(correction = "none", es = "pes"))

pander(EMK_PB_CH_an$anova_table)
Anova Table (Type 3 tests)
  num Df den Df MSE F pes Pr(>F)
group 1 67 6.017 0.4868 0.007213 0.4878
EMK_PB_CH_T1 1 67 6.017 35.83 0.3485 0.0000000938
train_time 1 67 6.017 1.818 0.02642 0.1821

PP

Without training time

EMK_PB_CH_an = aov_ez("ID", "d_EMK_PB_CH", qn_data_pp, between = c("group"), covariate = c("EMK_PB_CH_T1"), 
    observed = c("EMK_PB_CH_T1"), factorize = FALSE, anova_table = list(correction = "none", 
        es = "pes"))

pander(EMK_PB_CH_an$anova_table)
Anova Table (Type 3 tests)
  num Df den Df MSE F pes Pr(>F)
group 1 69 6.034 0.3697 0.005329 0.5452
EMK_PB_CH_T1 1 69 6.034 33.47 0.3266 0.0000001937
# https://thenewstatistics.com/itns/2020/07/04/3-easy-ways-to-obtain-cohens-d-and-its-ci/

# Calculate mean and SD (and square them) for T2-T1 difference per group (ZE and
# CG)
mean_rel_CG = mean(qn_data_pp[qn_data_pp$group == "CG", ]$d_EMK_PB_CH)
mean_rel_TG = mean(qn_data_pp[qn_data_pp$group == "TG", ]$d_EMK_PB_CH)

sd_rel_CG = sd(qn_data_pp[qn_data_pp$group == "CG", ]$d_EMK_PB_CH)
sd_rel_TG = sd(qn_data_pp[qn_data_pp$group == "TG", ]$d_EMK_PB_CH)

# Calculate difference between TG and CG
diff_mean_TG_CG = mean_rel_TG - mean_rel_CG

# Get number of participants per group
pnum = table(qn_data_pp["group"])
pnum_CG = pnum[1]
pnum_TG = pnum[2]

# Get Cohen's and confidence intervals
estimate = estimateStandardizedMeanDifference(mean_rel_TG, mean_rel_CG, sd_rel_TG, 
    sd_rel_CG, pnum_TG, pnum_CG, conf.level = 0.95)

# Retrieve them from list
EMK_PB_CH_d_pp = estimate$cohend
EMK_PB_CH_low_d_pp = estimate$cohend.low
EMK_PB_CH_high_d_pp = estimate$cohend.high

With training time

EMK_PB_CH_an = aov_ez("ID", "d_EMK_PB_CH", qn_data_pp, between = c("group"), covariate = c("EMK_PB_CH_T1", 
    "train_time"), observed = c("EMK_PB_CH_T1", "train_time"), factorize = FALSE, 
    anova_table = list(correction = "none", es = "pes"))

pander(EMK_PB_CH_an$anova_table)
Anova Table (Type 3 tests)
  num Df den Df MSE F pes Pr(>F)
group 1 66 6.011 0.662 0.009931 0.4188
EMK_PB_CH_T1 1 66 6.011 34.79 0.3452 0.0000001385
train_time 1 66 6.011 1.792 0.02643 0.1853

SDQ PB

ITT


Without training time

SDQ_PB_an = aov_ez("ID", "d_SDQ_PB", qn_data_itt, between = c("group"), covariate = c("SDQ_PB_T1"), 
    observed = c("SDQ_PB_T1"), factorize = FALSE, anova_table = list(correction = "none", 
        es = "pes"))

pander(SDQ_PB_an$anova_table)
Anova Table (Type 3 tests)
  num Df den Df MSE F pes Pr(>F)
group 1 71 2.239 7.5 0.09554 0.007796
SDQ_PB_T1 1 71 2.239 37.88 0.3479 0.00000003991
# https://thenewstatistics.com/itns/2020/07/04/3-easy-ways-to-obtain-cohens-d-and-its-ci/

# Calculate mean and SD (and square them) for T2-T1 difference per group (ZE and
# CG)
mean_rel_CG = mean(qn_data_itt[qn_data_itt$group == "CG", ]$d_SDQ_PB)
mean_rel_TG = mean(qn_data_itt[qn_data_itt$group == "TG", ]$d_SDQ_PB)

sd_rel_CG = sd(qn_data_itt[qn_data_itt$group == "CG", ]$d_SDQ_PB)
sd_rel_TG = sd(qn_data_itt[qn_data_itt$group == "TG", ]$d_SDQ_PB)

# Calculate difference between TG and CG
diff_mean_TG_CG = mean_rel_TG - mean_rel_CG

# Get number of participants per group
pnum = table(qn_data_itt["group"])
pnum_CG = pnum[1]
pnum_TG = pnum[2]

# Get Cohen's and confidence intervals
estimate = estimateStandardizedMeanDifference(mean_rel_TG, mean_rel_CG, sd_rel_TG, 
    sd_rel_CG, pnum_TG, pnum_CG, conf.level = 0.95)

# Retrieve them from list
SDQ_PB_d_itt = estimate$cohend
SDQ_PB_low_d_itt = estimate$cohend.low
SDQ_PB_high_d_itt = estimate$cohend.high


With training time

SDQ_PB_an = aov_ez("ID", "d_SDQ_PB", qn_data_itt, between = c("group"), covariate = c("SDQ_PB_T1", 
    "train_time"), observed = c("SDQ_PB_T1", "train_time"), factorize = FALSE, anova_table = list(correction = "none", 
    es = "pes"))

pander(SDQ_PB_an$anova_table)
Anova Table (Type 3 tests)
  num Df den Df MSE F pes Pr(>F)
group 1 67 2.036 7.031 0.09497 0.009991
SDQ_PB_T1 1 67 2.036 34.79 0.3418 0.0000001332
train_time 1 67 2.036 0.7113 0.0105 0.402

PP

Without training time

SDQ_PB_an = aov_ez("ID", "d_SDQ_PB", qn_data_pp, between = c("group"), covariate = c("SDQ_PB_T1"), 
    observed = c("SDQ_PB_T1"), factorize = FALSE, anova_table = list(correction = "none", 
        es = "pes"))

pander(SDQ_PB_an$anova_table)
Anova Table (Type 3 tests)
  num Df den Df MSE F pes Pr(>F)
group 1 69 2.155 9.122 0.1168 0.00354
SDQ_PB_T1 1 69 2.155 38.03 0.3553 0.00000004146
# https://thenewstatistics.com/itns/2020/07/04/3-easy-ways-to-obtain-cohens-d-and-its-ci/

# Calculate mean and SD (and square them) for T2-T1 difference per group (ZE and
# CG)
mean_rel_CG = mean(qn_data_pp[qn_data_pp$group == "CG", ]$d_SDQ_PB)
mean_rel_TG = mean(qn_data_pp[qn_data_pp$group == "TG", ]$d_SDQ_PB)

sd_rel_CG = sd(qn_data_pp[qn_data_pp$group == "CG", ]$d_SDQ_PB)
sd_rel_TG = sd(qn_data_pp[qn_data_pp$group == "TG", ]$d_SDQ_PB)

# Calculate difference between TG and CG
diff_mean_TG_CG = mean_rel_TG - mean_rel_CG

# Get number of participants per group
pnum = table(qn_data_pp["group"])
pnum_CG = pnum[1]
pnum_TG = pnum[2]

# Get Cohen's and confidence intervals
estimate = estimateStandardizedMeanDifference(mean_rel_TG, mean_rel_CG, sd_rel_TG, 
    sd_rel_CG, pnum_TG, pnum_CG, conf.level = 0.95)

# Retrieve them from list
SDQ_PB_d_pp = estimate$cohend
SDQ_PB_low_d_pp = estimate$cohend.low
SDQ_PB_high_d_pp = estimate$cohend.high


With training time

SDQ_PB_an = aov_ez("ID", "d_SDQ_PB", qn_data_pp, between = c("group"), covariate = c("SDQ_PB_T1", 
    "train_time"), observed = c("SDQ_PB_T1", "train_time"), factorize = FALSE, anova_table = list(correction = "none", 
    es = "pes"))

pander(SDQ_PB_an$anova_table)
Anova Table (Type 3 tests)
  num Df den Df MSE F pes Pr(>F)
group 1 66 2.065 6.949 0.09526 0.01044
SDQ_PB_T1 1 66 2.065 32.31 0.3287 0.0000003228
train_time 1 66 2.065 0.7042 0.01056 0.4044

SDQ BP

ITT


Without training time

SDQ_total_an = aov_ez("ID", "d_SDQ_Total", qn_data_itt, between = c("group"), covariate = c("SDQ_Total_T1"), 
    observed = c("SDQ_Total_T1"), factorize = FALSE, anova_table = list(correction = "none", 
        es = "pes"))

pander(SDQ_total_an$anova_table)
Anova Table (Type 3 tests)
  num Df den Df MSE F pes Pr(>F)
group 1 71 9.986 7.011 0.08987 0.009973
SDQ_Total_T1 1 71 9.986 24.09 0.2533 0.000005662
# https://thenewstatistics.com/itns/2020/07/04/3-easy-ways-to-obtain-cohens-d-and-its-ci/

# Calculate mean and SD (and square them) for T2-T1 difference per group (ZE and
# CG)
mean_rel_CG = mean(qn_data_itt[qn_data_itt$group == "CG", ]$d_SDQ_Total)
mean_rel_TG = mean(qn_data_itt[qn_data_itt$group == "TG", ]$d_SDQ_Total)

sd_rel_CG = sd(qn_data_itt[qn_data_itt$group == "CG", ]$d_SDQ_Total)
sd_rel_TG = sd(qn_data_itt[qn_data_itt$group == "TG", ]$d_SDQ_Total)

# Calculate difference between TG and CG
diff_mean_TG_CG = mean_rel_TG - mean_rel_CG

# Get number of participants per group
pnum = table(qn_data_itt["group"])
pnum_CG = pnum[1]
pnum_TG = pnum[2]

# Get Cohen's and confidence intervals
estimate = estimateStandardizedMeanDifference(mean_rel_TG, mean_rel_CG, sd_rel_TG, 
    sd_rel_CG, pnum_TG, pnum_CG, conf.level = 0.95)

# Retrieve them from list
SDQ_Total_d_itt = estimate$cohend
SDQ_Total_low_d_itt = estimate$cohend.low
SDQ_Total_high_d_itt = estimate$cohend.high


With training time

SDQ_total_an = aov_ez("ID", "d_SDQ_Total", qn_data_itt, between = c("group"), covariate = c("SDQ_Total_T1", 
    "train_time"), observed = c("SDQ_Total_T1", "train_time"), factorize = FALSE, 
    anova_table = list(correction = "none", es = "pes"))

pander(SDQ_total_an$anova_table)
Anova Table (Type 3 tests)
  num Df den Df MSE F pes Pr(>F)
group 1 67 10.14 5.918 0.08116 0.01766
SDQ_Total_T1 1 67 10.14 19.58 0.2262 0.00003631
train_time 1 67 10.14 2.521 0.03627 0.117

PP

Without training time

SDQ_total_an = aov_ez("ID", "d_SDQ_Total", qn_data_pp, between = c("group"), covariate = c("SDQ_Total_T1"), 
    observed = c("SDQ_Total_T1"), factorize = FALSE, anova_table = list(correction = "none", 
        es = "pes"))

pander(SDQ_total_an$anova_table)
Anova Table (Type 3 tests)
  num Df den Df MSE F pes Pr(>F)
group 1 69 10.26 6.615 0.08748 0.01227
SDQ_Total_T1 1 69 10.26 21.28 0.2357 0.00001775
# https://thenewstatistics.com/itns/2020/07/04/3-easy-ways-to-obtain-cohens-d-and-its-ci/

# Calculate mean and SD (and square them) for T2-T1 difference per group (ZE and
# CG)
mean_rel_CG = mean(qn_data_pp[qn_data_pp$group == "CG", ]$d_SDQ_Total)
mean_rel_TG = mean(qn_data_pp[qn_data_pp$group == "TG", ]$d_SDQ_Total)

sd_rel_CG = sd(qn_data_pp[qn_data_pp$group == "CG", ]$d_SDQ_Total)
sd_rel_TG = sd(qn_data_pp[qn_data_pp$group == "TG", ]$d_SDQ_Total)

# Calculate difference between TG and CG
diff_mean_TG_CG = mean_rel_TG - mean_rel_CG

# Get number of participants per group
pnum = table(qn_data_pp["group"])
pnum_CG = pnum[1]
pnum_TG = pnum[2]

# Get Cohen's and confidence intervals
estimate = estimateStandardizedMeanDifference(mean_rel_TG, mean_rel_CG, sd_rel_TG, 
    sd_rel_CG, pnum_TG, pnum_CG, conf.level = 0.95)

# Retrieve them from list
SDQ_Total_d_pp = estimate$cohend
SDQ_Total_low_d_pp = estimate$cohend.low
SDQ_Total_high_d_pp = estimate$cohend.high


With training time

SDQ_total_an = aov_ez("ID", "d_SDQ_Total", qn_data_pp, between = c("group"), covariate = c("SDQ_Total_T1", 
    "train_time"), observed = c("SDQ_Total_T1", "train_time"), factorize = FALSE, 
    anova_table = list(correction = "none", es = "pes"))

pander(SDQ_total_an$anova_table)
Anova Table (Type 3 tests)
  num Df den Df MSE F pes Pr(>F)
group 1 66 10.28 5.882 0.08182 0.01804
SDQ_Total_T1 1 66 10.28 19.15 0.2249 0.00004399
train_time 1 66 10.28 2.484 0.03626 0.1198

Secondary outcome: ERPs

Visualization

# Load EEG topography data
topo_emo_cg = read.delim("./data/PFV_emo_topo_cg.txt", header = TRUE, sep = " ", 
    dec = ".")
topo_emo_tg = read.delim("./data/PFV_emo_topo_tg.txt", header = TRUE, sep = " ", 
    dec = ".")

# Load ERP data
P1_P3_traj = read.delim("./data/P1_P3_traj.txt", header = TRUE, sep = " ", dec = ".")

# De-select ape faces (event code: 4)
P1_P3_traj = subset(P1_P3_traj, cond != 4)

# Rename emotion condition values
P1_P3_traj$cond[P1_P3_traj$cond == 1] = "happy"
P1_P3_traj$cond[P1_P3_traj$cond == 2] = "neutral"
P1_P3_traj$cond[P1_P3_traj$cond == 3] = "angry"

# Match info of qn_data with EEG data
P1_P3_traj$group = qn_data$group[match(P1_P3_traj$ID, qn_data_itt$ID, nomatch = NA)]
P1_P3_traj$group = factor(P1_P3_traj$group)

# De-select participants with sufficient EEG data
P1_P3_traj = subset(P1_P3_traj, ID != "21" & ID != "30" & ID != "54" & ID != "68" & 
    ID != "69" & ID != "71" & ID != "72" & ID != "73" & ID != "75")

# Topoplots P3 - Group x Emotion effects

# Control group
ga_topo_long_cg = gather(topo_emo_cg, electrode, amplitude, Fp1:Oz, factor_key = TRUE)

# Rename A1/A2
names(ga_topo_long_cg)[names(ga_topo_long_cg) == "A1"] = "TP9"
names(ga_topo_long_cg)[names(ga_topo_long_cg) == "A2"] = "TP10"

# Plot topoplots for happy
Topo_Emo_Hap_CG = subset(ga_topo_long_cg, emo == 1)

# Plot topoplots for neutral
Topo_Emo_Neu_CG = subset(ga_topo_long_cg, emo == 3)

# Plot topoplots for angry
Topo_Emo_Ang_CG = subset(ga_topo_long_cg, emo == 2)

# Calculate difference score angry-neutral
Topo_Diff_Ang_Neu_CG = data.frame(time = Topo_Emo_Hap_CG[, 1], electrode = Topo_Emo_Hap_CG[, 
    3], amplitude = Topo_Emo_Ang_CG$amplitude - Topo_Emo_Neu_CG$amplitude)


# Calculate difference score happy-neutral
Topo_Diff_Hap_Neu_CG = data.frame(time = Topo_Emo_Hap_CG[, 1], electrode = Topo_Emo_Hap_CG[, 
    3], amplitude = Topo_Emo_Hap_CG$amplitude - Topo_Emo_Neu_CG$amplitude)


# Calculate difference score happy-angry
Topo_Diff_Hap_Ang_CG = data.frame(time = Topo_Emo_Hap_CG[, 1], electrode = Topo_Emo_Hap_CG[, 
    3], amplitude = Topo_Emo_Hap_CG$amplitude - Topo_Emo_Ang_CG$amplitude)

# Select time windows
Topo_Diff_Ang_Neu_CG_P3 = subset(Topo_Diff_Ang_Neu_CG, time >= 300 & time <= 500)
Topo_Diff_Hap_Neu_CG_P3 = subset(Topo_Diff_Hap_Neu_CG, time >= 300 & time <= 500)
Topo_Diff_Hap_Ang_CG_P3 = subset(Topo_Diff_Hap_Ang_CG, time >= 300 & time <= 500)

# Add electrode information
Topo_Diff_Ang_Neu_CG_P3 = electrode_locations(Topo_Diff_Ang_Neu_CG_P3, electrode = "electrode", 
    drop = FALSE, montage = NULL)

Topo_Diff_Hap_Neu_CG_P3 = electrode_locations(Topo_Diff_Hap_Neu_CG_P3, electrode = "electrode", 
    drop = FALSE, montage = NULL)

Topo_Diff_Hap_Ang_CG_P3 = electrode_locations(Topo_Diff_Hap_Ang_CG_P3, electrode = "electrode", 
    drop = FALSE, montage = NULL)

# Draw topographies
Topo_Diff_Ang_Neu_CG_P3_plot = ggplot(Topo_Diff_Ang_Neu_CG_P3, aes(x = x, y = y, 
    fill = amplitude, label = electrode)) + ggtitle("angry – neutral") + geom_topo(grid_res = 300, 
    interp_limit = "head", chan_markers = "point", chan_size = 0.5, head_size = 0.9) + 
    scale_fill_distiller(palette = "RdBu", limits = c(-1.5, 1.5)) + theme_void() + 
    coord_equal() + labs(fill = expression(paste("Amplitude (", mu, "V)"))) + theme(legend.position = "none", 
    plot.title = element_text(size = 8, face = "bold", hjust = 0.5))


# Draw topographies
Topo_Diff_Hap_Neu_CG_P3_plot = ggplot(Topo_Diff_Hap_Neu_CG_P3, aes(x = x, y = y, 
    fill = amplitude, label = electrode)) + ggtitle("  happy – neutral") + geom_topo(grid_res = 300, 
    interp_limit = "head", chan_markers = "point", chan_size = 0.5, head_size = 0.9) + 
    scale_fill_distiller(palette = "RdBu", limits = c(-1.5, 1.5)) + theme_void() + 
    coord_equal() + labs(fill = expression(paste("Amplitude (", mu, "V)"))) + theme(legend.position = "none", 
    plot.title = element_text(size = 8, face = "bold", hjust = 0.5))

# Draw topographies
Topo_Diff_Hap_Ang_CG_P3_plot = ggplot(Topo_Diff_Hap_Ang_CG_P3, aes(x = x, y = y, 
    fill = amplitude, label = electrode)) + ggtitle("  happy – angy") + geom_topo(grid_res = 300, 
    interp_limit = "head", chan_markers = "point", chan_size = 0.5, head_size = 0.9) + 
    scale_fill_distiller(palette = "RdBu", limits = c(-1.5, 1.5)) + theme_void() + 
    coord_equal() + labs(fill = expression(paste("Amplitude (", mu, "V)"))) + theme(legend.position = "none", 
    plot.title = element_text(size = 8, face = "bold", hjust = 0.5))


# Training group
ga_topo_long_tg = gather(topo_emo_tg, electrode, amplitude, Fp1:Oz, factor_key = TRUE)

# Rename A1/A2
names(ga_topo_long_tg)[names(ga_topo_long_tg) == "A1"] = "TP9"
names(ga_topo_long_tg)[names(ga_topo_long_tg) == "A2"] = "TP10"

# Plot topoplots for happy
Topo_Emo_Hap_TG = subset(ga_topo_long_tg, emo == 1)

# Plot topoplots for neutral
Topo_Emo_Neu_TG = subset(ga_topo_long_tg, emo == 3)

# Plot topoplots for angry
Topo_Emo_Ang_TG = subset(ga_topo_long_tg, emo == 2)

# Calculate difference score angry-neutral
Topo_Diff_Ang_Neu_TG = data.frame(time = Topo_Emo_Hap_TG[, 1], electrode = Topo_Emo_Hap_TG[, 
    3], amplitude = Topo_Emo_Ang_TG$amplitude - Topo_Emo_Neu_TG$amplitude)


# Calculate difference score happy-neutral
Topo_Diff_Hap_Neu_TG = data.frame(time = Topo_Emo_Hap_TG[, 1], electrode = Topo_Emo_Hap_TG[, 
    3], amplitude = Topo_Emo_Hap_TG$amplitude - Topo_Emo_Neu_TG$amplitude)


# Calculate difference score happy-angry
Topo_Diff_Hap_Ang_TG = data.frame(time = Topo_Emo_Hap_TG[, 1], electrode = Topo_Emo_Hap_TG[, 
    3], amplitude = Topo_Emo_Hap_TG$amplitude - Topo_Emo_Ang_TG$amplitude)

# Select time windows
Topo_Diff_Ang_Neu_TG_P3 = subset(Topo_Diff_Ang_Neu_TG, time >= 300 & time <= 500)
Topo_Diff_Hap_Neu_TG_P3 = subset(Topo_Diff_Hap_Neu_TG, time >= 300 & time <= 500)
Topo_Diff_Hap_Ang_TG_P3 = subset(Topo_Diff_Hap_Ang_TG, time >= 300 & time <= 500)

# Add electrode information
Topo_Diff_Ang_Neu_TG_P3 = electrode_locations(Topo_Diff_Ang_Neu_TG_P3, electrode = "electrode", 
    drop = FALSE, montage = NULL)

Topo_Diff_Hap_Neu_TG_P3 = electrode_locations(Topo_Diff_Hap_Neu_TG_P3, electrode = "electrode", 
    drop = FALSE, montage = NULL)

Topo_Diff_Hap_Ang_TG_P3 = electrode_locations(Topo_Diff_Hap_Ang_TG_P3, electrode = "electrode", 
    drop = FALSE, montage = NULL)

# Draw topographies
Topo_Diff_Ang_Neu_TG_P3_plot = ggplot(Topo_Diff_Ang_Neu_TG_P3, aes(x = x, y = y, 
    fill = amplitude, label = electrode)) + ggtitle("angry – neutral") + geom_topo(grid_res = 300, 
    interp_limit = "head", chan_markers = "point", chan_size = 0.5, head_size = 0.9) + 
    scale_fill_distiller(palette = "RdBu", limits = c(-1.5, 1.5)) + theme_void() + 
    coord_equal() + labs(fill = expression(paste("Amplitude (", mu, "V)"))) + theme(legend.position = "none", 
    plot.title = element_text(size = 8, face = "bold", hjust = 0.5))


# Draw topographies
Topo_Diff_Hap_Neu_TG_P3_plot = ggplot(Topo_Diff_Hap_Neu_TG_P3, aes(x = x, y = y, 
    fill = amplitude, label = electrode)) + ggtitle("  happy – neutral") + geom_topo(grid_res = 300, 
    interp_limit = "head", chan_markers = "point", chan_size = 0.5, head_size = 0.9) + 
    scale_fill_distiller(palette = "RdBu", limits = c(-1.5, 1.5)) + theme_void() + 
    coord_equal() + labs(fill = expression(paste("Amplitude (", mu, "V)"))) + theme(legend.position = "none", 
    plot.title = element_text(size = 8, face = "bold", hjust = 0.5))

Topo_Diff_Hap_Ang_TG_P3_plot = ggplot(Topo_Diff_Hap_Ang_TG_P3, aes(x = x, y = y, 
    fill = amplitude, label = electrode)) + ggtitle("  happy – angry") + geom_topo(grid_res = 300, 
    interp_limit = "head", chan_markers = "point", chan_size = 0.5, head_size = 0.9) + 
    scale_fill_distiller(palette = "RdBu", limits = c(-1.5, 1.5)) + theme_void() + 
    coord_equal() + labs(fill = expression(paste("Amplitude (", mu, "V)"))) + theme(legend.position = "none", 
    plot.title = element_text(size = 8, face = "bold", hjust = 0.5))


# Display plots
fig_topo_P3_emo_CG = cowplot::plot_grid(Topo_Diff_Hap_Neu_CG_P3_plot, Topo_Diff_Ang_Neu_CG_P3_plot, 
    Topo_Diff_Hap_Ang_CG_P3_plot, nrow = 1)


ggsave(fig_topo_P3_emo_CG, file = "Topo_P3_CG.png", dpi = 300, bg = "transparent")

fig_topo_P3_emo_TG = cowplot::plot_grid(Topo_Diff_Hap_Neu_TG_P3_plot, Topo_Diff_Ang_Neu_TG_P3_plot, 
    Topo_Diff_Hap_Ang_TG_P3_plot, nrow = 1)

ggsave(fig_topo_P3_emo_TG, file = "Topo_P3_TG.png", dpi = 300, bg = "transparent")


# ERP - Plot differences between training and control group

group.labs = c("Controls (N = 34)", "Zirkus Empathico (N = 33)", "")
names(group.labs) = c("CG", "TG")


ERP_group = ggplot(P1_P3_traj, aes(time, amplitude)) + theme(panel.background = element_blank(), 
    panel.border = element_rect(colour = "grey", fill = NA, size = 2), axis.title.y = element_text(size = 10, 
        margin = margin(t = 0, r = 5, b = 0, l = 0)), axis.title.x = element_text(size = 10, 
        margin = margin(t = 0, r = 0, b = 0, l = 0)), legend.key = element_rect(fill = "white")) + 
    stat_summary(fun.y = mean, geom = "line", size = 1, linetype = "solid", aes(colour = cond)) + 
    scale_colour_manual(values = ZE_ERP_col) + # ggtitle('P1 & P3') +
theme(legend.position = "top", strip.background = element_rect(color = "darkgrey", 
    fill = "white", size = 1, linetype = "solid"), strip.text.x = element_text(size = 10, 
    face = "bold")) + labs(x = "\nTime [ms]", y = expression(paste("Amplitude [", 
    mu, "V]")), colour = "") + coord_cartesian(ylim = c(-1.5, 18), xlim = c(-100, 
    600)) + scale_y_continuous(breaks = seq(-2, 18, 2)) + scale_x_continuous(breaks = seq(-100, 
    600, 200)) + geom_vline(xintercept = 0, linetype = "dashed", colour = "grey") + 
    geom_hline(yintercept = 0, linetype = "dashed", colour = "grey") + ggplot2::annotate("rect", 
    xmin = 90, xmax = 130, ymin = -3, ymax = 20, alpha = 0.2) + ggplot2::annotate("rect", 
    xmin = 180, xmax = 220, ymin = -3, ymax = 20, alpha = 0.2) + ggplot2::annotate("rect", 
    xmin = 300, xmax = 500, ymin = -3, ymax = 20, alpha = 0.2) + facet_wrap(~group, 
    labeller = labeller(group = group.labs), ncol = 2)

ggsave(ERP_group, file = "Grouped_ERP.png", dpi = 300, bg = "transparent")


# Get legend
Topo_Diff_leg = ggplot(Topo_Diff_Hap_Neu_TG_P3, aes(x = x, y = y, fill = amplitude, 
    label = electrode)) + geom_topo(grid_res = 300, interp_limit = "head", chan_markers = "point", 
    chan_size = 0.5, head_size = 0.9) + scale_fill_distiller(palette = "RdBu", limits = c(-1.5, 
    1)) + theme_void() + coord_equal() + labs(fill = expression(paste("", mu, "V"))) + 
    theme(legend.position = "right", plot.title = element_text(size = 5, face = "bold", 
        hjust = 0.5))

topo_leg = get_legend(Topo_Diff_leg)

ggsave(topo_leg, file = "leg_topo.png", dpi = 300, bg = "transparent")

# Combine figures
fig_topo = cowplot::plot_grid(NULL, fig_topo_P3_emo_CG, NULL, fig_topo_P3_emo_TG, 
    NULL, topo_leg, ncol = 6, rel_widths = c(0.1, 1, 0.1, 1, 0.1, 0.2), rel_heights = c(0.1, 
        1, 0.1, 1, 0.1, 0.2))

fig_topo_erp = cowplot::plot_grid(ERP_group, fig_topo, nrow = 2, rel_heights = c(1, 
    0.4))

fig_topo_erp

# Save figure
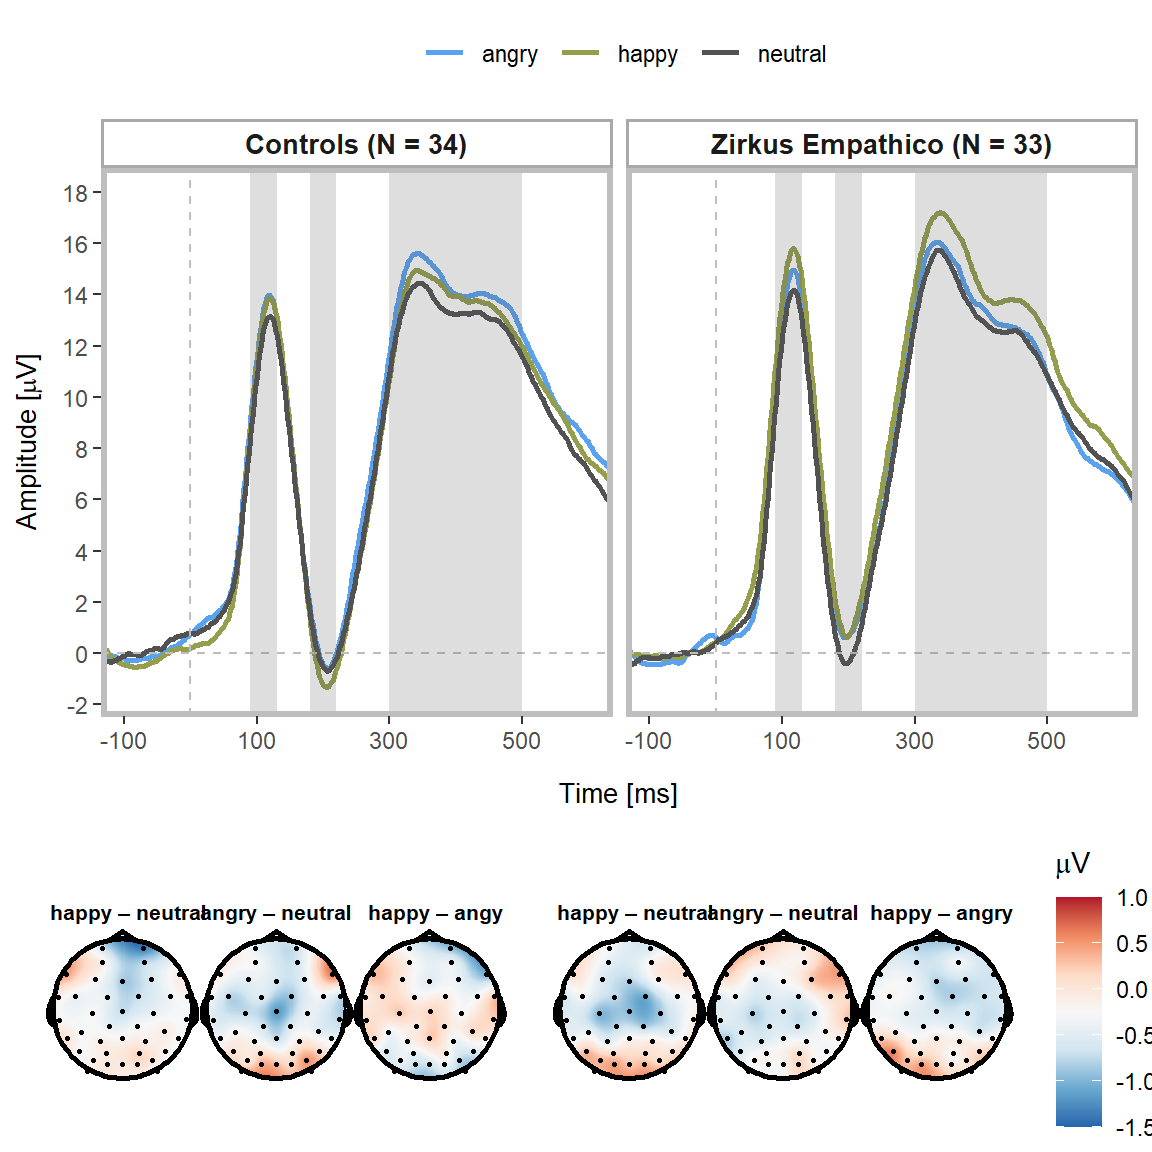
ggsave(fig_topo_erp, file = "zerp_erps.png", dpi = 300)

P1

P1_data = subset(erp_data_long, emotion == "P1_amp_hap" | emotion == "P1_amp_ang" | 
    emotion == "P1_amp_neu")

P1_amp_all_emo_an = aov_ez("ID", "amplitude", P1_data, between = c("group"), within = c("emotion"), 
    anova_table = list(correction = "none", es = "pes"))

pander(P1_amp_all_emo_an$anova_table)
Anova Table (Type 3 tests)
  num Df den Df MSE F pes Pr(>F)
group 1 65 80.67 0.6403 0.009754 0.4265
emotion 2 130 3.598 4.828 0.06913 0.009498
group:emotion 2 130 3.598 1.219 0.01842 0.2987

Post-hoc tests

# Display post-hoc test results
pander(P1_amp_ph_res)
contrast estimate SE df t.ratio p.value
P1_amp_hap - P1_amp_neu 1.001 0.3278 130 3.055 0.007648
P1_amp_hap - P1_amp_ang 0.3394 0.3278 130 1.036 0.5558
P1_amp_neu - P1_amp_ang -0.6618 0.3278 130 -2.019 0.1116

N170

N170_data = subset(erp_data_long, emotion == "N170_amp_hap" | emotion == "N170_amp_ang" | 
    emotion == "N170_amp_neu")

N170_amp_all_emo_an = aov_ez("ID", "amplitude", N170_data, between = c("group"), 
    within = c("emotion"), anova_table = list(correction = "none", es = "pes"))

pander(N170_amp_all_emo_an$anova_table)
Anova Table (Type 3 tests)
  num Df den Df MSE F pes Pr(>F)
group 1 65 16.13 0.122 0.001874 0.728
emotion 2 130 1.894 0.4163 0.006363 0.6604
group:emotion 2 130 1.894 0.4648 0.0071 0.6293

P3

P3_data = subset(erp_data_long, emotion == "P3_amp_hap" | emotion == "P3_amp_ang" | 
    emotion == "P3_amp_neu")

P3_amp_all_emo_an = aov_ez("ID", "amplitude", P3_data, between = c("group"), within = c("emotion"), 
    anova_table = list(correction = "none", es = "pes"))

pander(P3_amp_all_emo_an$anova_table)
Anova Table (Type 3 tests)
  num Df den Df MSE F pes Pr(>F)
group 1 65 107.9 0.01862 0.0002863 0.8919
emotion 2 130 3.563 3.671 0.05346 0.02812
group:emotion 2 130 3.563 3.404 0.04977 0.03622
# Display post-hoc test results
pander(P3_amp_ph_res)
contrast estimate SE df t.ratio p.value
P3_amp_hap - P3_amp_neu 0.8816 0.3262 130 2.703 0.02112
P3_amp_hap - P3_amp_ang 0.3876 0.3262 130 1.188 0.4622
P3_amp_neu - P3_amp_ang -0.494 0.3262 130 -1.515 0.2874
# Display post-hoc test results
pander(P3_amp_ph_emo_neu)
contrast group estimate SE df t.ratio p.value
P3_amp_hap - P3_amp_neu CG 0.3868 0.4578 130 0.8449 0.6759
P3_amp_hap - P3_amp_ang CG -0.4595 0.4578 130 -1.004 0.5759
P3_amp_neu - P3_amp_ang CG -0.8463 0.4578 130 -1.849 0.1581
P3_amp_hap - P3_amp_neu TG 1.376 0.4647 130 2.962 0.0101
P3_amp_hap - P3_amp_ang TG 1.235 0.4647 130 2.657 0.02394
P3_amp_neu - P3_amp_ang TG -0.1418 0.4647 130 -0.3052 0.95
# Display post-hoc test results
pander(P3_amp_ph_emo_neu2)
contrast emotion estimate SE df t.ratio p.value
CG - TG P3_amp_hap -1.095 1.513 73.7 -0.7233 0.4718
CG - TG P3_amp_neu -0.1049 1.513 73.7 -0.06932 0.9449
CG - TG P3_amp_ang 0.5995 1.513 73.7 0.3961 0.6932

Effect size summary

Intent-to-treat

d_itt = c(GEM_Total_d_itt, EMK_EM_CH_d_itt, EMK_EM_P_d_itt, EMK_ER_CH_d_itt, EMK_ER_P_d_itt, 
    EMK_PB_CH_d_itt, SDQ_Total_d_itt, SDQ_PB_d_itt)

low_itt = c(GEM_Total_low_d_itt, EMK_EM_CH_low_d_itt, EMK_EM_P_low_d_itt, EMK_ER_CH_low_d_itt, 
    EMK_ER_P_low_d_itt, EMK_PB_CH_low_d_itt, SDQ_Total_low_d_itt, SDQ_PB_low_d_itt)

high_itt = c(GEM_Total_high_d_itt, EMK_EM_CH_high_d_itt, EMK_EM_P_high_d_itt, EMK_ER_CH_high_d_itt, 
    EMK_ER_P_high_d_itt, EMK_PB_CH_high_d_itt, SDQ_Total_high_d_itt, SDQ_PB_high_d_itt)

eff_size_itt = data.frame(d_itt, low_itt, high_itt)

pander(eff_size_itt)
d_itt low_itt high_itt
0.2306 -0.2276 0.7029
0.2933 -0.1639 0.7685
0.2826 -0.1747 0.7573
0.5729 0.117 1.064
0.03727 -0.4253 0.5021
0.02 -0.443 0.4843
0.5095 0.05377 0.9965
0.5362 0.08044 1.025

Per-protocol analysis

d_pp = c(GEM_Total_d_pp, EMK_EM_CH_d_pp, EMK_EM_P_d_pp, EMK_ER_CH_d_pp, EMK_ER_P_d_pp, 
    EMK_PB_CH_d_pp, SDQ_Total_d_pp, SDQ_PB_d_pp)

low_pp = c(GEM_Total_low_d_pp, EMK_EM_CH_low_d_pp, EMK_EM_P_low_d_pp, EMK_ER_CH_low_d_pp, 
    EMK_ER_P_low_d_pp, EMK_PB_CH_low_d_pp, SDQ_Total_low_d_pp, SDQ_PB_low_d_pp)

high_pp = c(GEM_Total_high_d_pp, EMK_EM_CH_high_d_pp, EMK_EM_P_high_d_pp, EMK_ER_CH_high_d_pp, 
    EMK_ER_P_high_d_pp, EMK_PB_CH_high_d_pp, SDQ_Total_high_d_pp, SDQ_PB_high_d_pp)

eff_size_pp = data.frame(d_pp, low_pp, high_pp)

pander(eff_size_pp)
d_pp low_pp high_pp
0.202 -0.2636 0.6805
0.2776 -0.1867 0.7596
0.3161 -0.1477 0.8
0.5425 0.07993 1.039
0.05112 -0.4182 0.5236
0.04225 -0.4273 0.5145
0.4609 -0.00174 0.9528
0.6218 0.1589 1.124

ERPs

P1

# https://cran.r-project.org/web/packages/effectsize/vignettes/anovaES.html
# https://ademos.people.uic.edu/Chapter21.html

d_erp = c(P1_d_emo, P1_d_group, P1_d_emo_gr)

low_erp = c(P1_low_CI_emo, P1_low_CI_group, P1_low_CI_emo_gr)

high_erp = c(P1_high_CI_emo, P1_high_CI_group, P1_high_CI_emo_gr)

eff_size_erp = data.frame(d_erp, low_erp, high_erp)

pander(eff_size_erp)
d_erp low_erp high_erp
0.1552 0 0.3729
0.19 0 0.5964
0.07804 0 0.2024

N170

d_erp = c(N170_d_emo, N170_d_group, N170_d_emo_gr)

low_erp = c(N170_low_CI_emo, N170_low_CI_group, N170_low_CI_emo_gr)

high_erp = c(N170_high_CI_emo, N170_high_CI_group, N170_high_CI_emo_gr)

eff_size_erp = data.frame(d_erp, low_erp, high_erp)

pander(eff_size_erp)
d_erp low_erp high_erp
0.0697 0 0.1044
0.07793 0 0.1168
0.0737 0 0.1836

P3

d_erp = c(P3_d_emo, P3_d_group, P3_d_emo_gr)

low_erp = c(P3_low_CI_emo, P3_low_CI_group, P3_low_CI_emo_gr)

high_erp = c(P3_high_CI_emo, P3_high_CI_group, P3_high_CI_emo_gr)

eff_size_erp = data.frame(d_erp, low_erp, high_erp)

pander(eff_size_erp)
d_erp low_erp high_erp
0.1181 0 0.3105
0.03273 0 0.04904
0.1139 0 0.3021

Session info

# Get session info
sessionInfo()
R version 4.0.2 (2020-06-22)
Platform: x86_64-w64-mingw32/x64 (64-bit)
Running under: Windows 10 x64 (build 18362)

Matrix products: default

locale:
[1] LC_COLLATE=German_Germany.1252  LC_CTYPE=German_Germany.1252   
[3] LC_MONETARY=German_Germany.1252 LC_NUMERIC=C                   
[5] LC_TIME=German_Germany.1252    

attached base packages:
[1] stats     graphics  grDevices utils     datasets  methods   base     

other attached packages:
 [1] sjstats_0.18.1      sjPlot_2.8.7        rstatix_0.7.0      
 [4] RColorBrewer_1.1-2  psych_2.1.3         plyr_1.8.6         
 [7] ppcor_1.1           MASS_7.3-53.1       pander_0.6.3       
[10] jmv_1.2.23          ggpubr_0.4.0        GGally_2.1.1       
[13] foreign_0.8-81      esci_0.1.1          emmeans_1.5.5-1    
[16] eegUtils_0.5.0      corrplot_0.84       car_3.0-10         
[19] carData_3.0-4       broom_0.7.6         afex_0.28-1        
[22] lme4_1.1-26         Matrix_1.3-2        tadaatoolbox_0.17.0
[25] miceadds_3.11-6     mice_3.13.0         gtsummary_1.4.0    
[28] expss_0.10.7        eeptools_1.2.4      XLConnect_1.0.3    
[31] forcats_0.5.1       stringr_1.4.0       dplyr_1.0.5        
[34] purrr_0.3.4         readr_1.4.0         tidyr_1.1.3        
[37] tibble_3.1.1        ggplot2_3.3.3       tidyverse_1.3.1    
[40] kableExtra_1.3.4   

loaded via a namespace (and not attached):
 [1] estimability_1.3     R.methodsS3_1.8.1    coda_0.19-4         
 [4] knitr_1.32           multcomp_1.4-16      R.utils_2.10.1      
 [7] data.table_1.14.0    rpart_4.1-15         generics_0.1.0      
[10] cowplot_1.1.1        TH.data_1.0-10       commonmark_1.7      
[13] proxy_0.4-25         future_1.21.0        webshot_0.5.2       
[16] xml2_1.3.2           lubridate_1.7.10     httpuv_1.5.5        
[19] assertthat_0.2.1     viridis_0.6.0        xfun_0.22           
[22] hms_1.0.0            jquerylib_0.1.3      rJava_0.9-13        
[25] evaluate_0.14        promises_1.2.0.1     fansi_0.4.2         
[28] dbplyr_2.1.1         readxl_1.3.1         DBI_1.1.1           
[31] tmvnsim_1.0-2        htmlwidgets_1.5.3    reshape_0.8.8       
[34] ellipsis_0.3.1       backports_1.2.1      signal_0.7-6        
[37] bookdown_0.21        insight_0.13.2       jmvcore_1.2.23      
[40] vctrs_0.3.7          sjlabelled_1.1.7     abind_1.4-5         
[43] withr_2.4.2          checkmate_2.0.0      vcd_1.4-8           
[46] mnormt_2.0.2         svglite_2.0.0        cluster_2.1.2       
[49] lazyeval_0.2.2       crayon_1.4.1         labeling_0.4.2      
[52] pkgconfig_2.0.3      nlme_3.1-152         vipor_0.4.5         
[55] nnet_7.3-15          rlang_0.4.10         globals_0.14.0      
[58] lifecycle_1.0.0      miniUI_0.1.1.1       sandwich_3.0-0      
[61] modelr_0.1.8         cellranger_1.1.0     matrixStats_0.58.0  
[64] lmtest_0.9-38        boot_1.3-27          zoo_1.8-9           
[67] reprex_2.0.0         base64enc_0.1-3      beeswarm_0.4.0      
[70] png_0.1-7            viridisLite_0.4.0    ini_0.3.1           
[73] parameters_0.13.0    rootSolve_1.8.2.1    shinydashboard_0.7.1
[76] R.oo_1.24.0          maptools_1.1-1       arm_1.11-2          
[79] parallelly_1.24.0    jpeg_0.1-8.1        
 [ reached getOption("max.print") -- omitted 86 entries ]